Wordpress (PHP) debugging in your IDE using Docker and Xdebug
So I started using WordPress as a REST API server since that’s the foundation of the Block Editor…
You might be wondering what’s does the Rest API has to do with Debugging?
Well, it turns out that you can no use the combination of wp_die with print_r to find out what a variable or object contains! (Duh!)
<?php
// This does nothing when developing an API.
wp_die( print_r( $my_var, true ) );
When you are working with REST calls, you really need a debugger in those cases when you are not sure what the contents of a WordPress object or variable have. So Debuggin here is a must.
But, even tough setting up a debugger in PHP is an easy task, is not that well documented. Specially when you are working with Docker.
So here are the steps I take to setup debugging when using WordPress inside the Official WordPress Docker Image.
TOC
- Setup WordPress in a container
- Create a WordPress plugin to show Xdebug info
- Create a custom Docker Image
- Explaining some Gotchas
- Configure Visual Studio Code
- Start a debugging session
- Resources
Setup WordPress in a container
Ok, lets start by creating the development environment for a custom plugin:
mkdir wordpress-docker-xdebug
cd $_
touch Dockerfile docker-compose.yaml plugin.php
And on the docker-compose.yaml add the following code to create a minimal WordPress environment whith a MariaDB database and the official WordPress image
I use MariaDB instead of MySQL because the Docker image for it is much more lighter than the MySQL Docker image
version: '3'

services:

  db:
    image: mariadb
    container_name: wp-xdebug-db
    environment:
      MYSQL_ROOT_PASSWORD: root
      MYSQL_DATABASE: wordpress
      MYSQL_USER: wordpress
      MYSQL_PASSWORD: wordpress
    volumes:
      - wp-xdebug-data:/var/lib/mysql

  wp:
    image: wordpress:5-apache
    container_name: wp-xdebug-wp
    environment:
      WORDPRESS_DB_HOST: wp-xdebug-db
      WORDPRESS_DB_USER: wordpress
      WORDPRESS_DB_PASSWORD: wordpress
      WORDPRESS_DB_NAME: wordpress
    volumes:
      - wp-xdebug-html:/var/www/html
      - ./:/var/www/html/wp-content/plugins/wordpress-docker-xdebug
    ports:
      - 3000:80

volumes:
  wp-xdebug-data:
  wp-xdebug-html:

networks:
  default:
    name: wp-xdebug-network
Most of the magic on the docker-compose.yaml file happens is in the placement of environment variables. For information on what the variables for MariaDB and WordPress mean, head over to the respective Dockerhub pages. But in summary:
- Give the DB
rootuser the passwordroot - Create the
wordpressdatabase - Create the user
wordpresswith passwordwordpressin the database - Make the
/var/lib/mysqldirectory in the DB container persistent - Make the
/var/www/htmldirectory in the WordPress container persistent - Connect the current directory with
/var/www/html/wp-content/plugins/wordpress-docker-xdebugdirectory inside the WordPress container
Also, notice how I’m instructing Docker to run WordPress in port 3000
Finally, just start the image
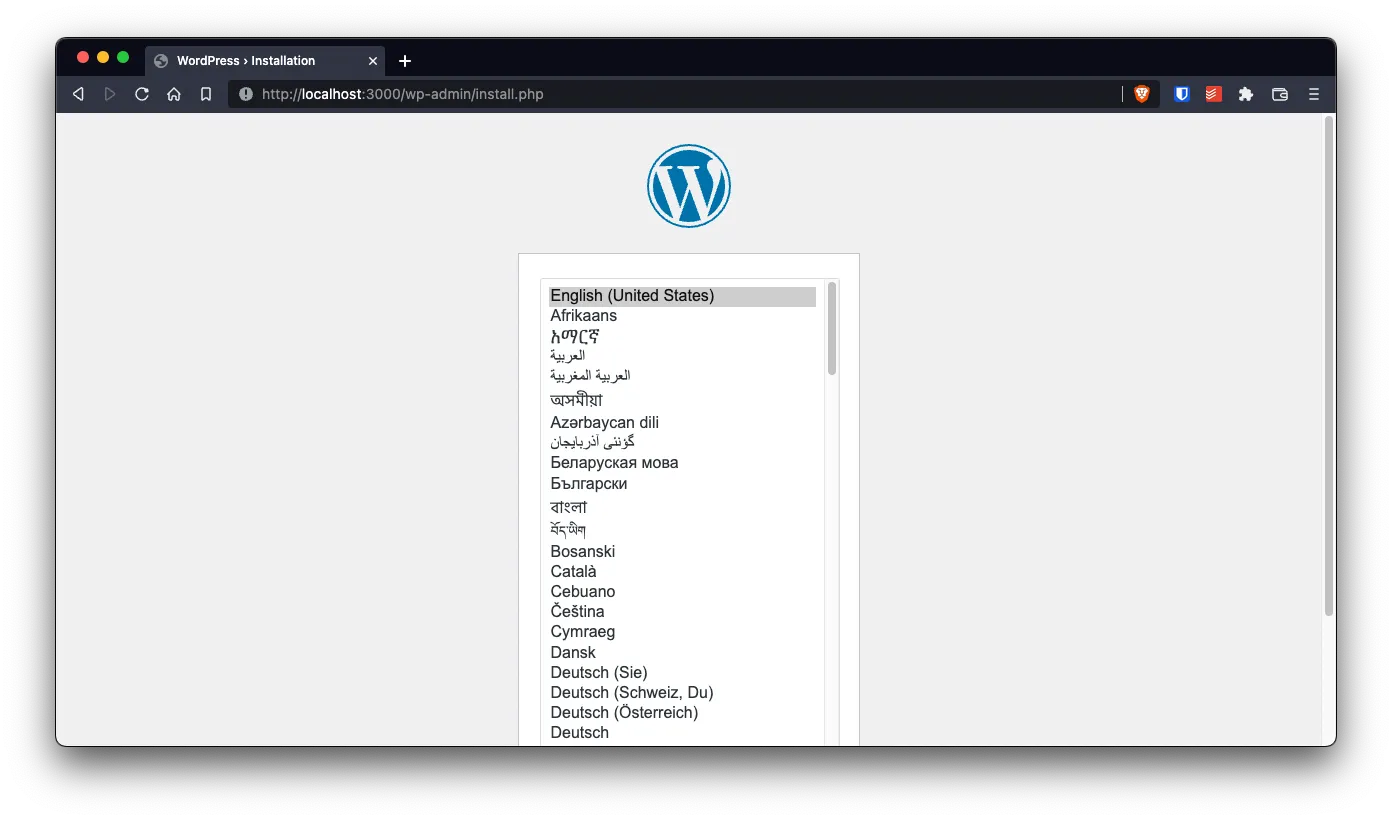
docker-compose up -dNow, open up a browser on http://localhost:3000 and install WordPress like you normally would.
And we’re done for the first part.
Create a WordPress plugin to show Xdebug info
In the previous step we told Docker that the current directory (./) is mapped to a plugin directory (/var/www/html/wp-content/plugins/wordpress-docker-xdebug). So, just by placing the following code in the plugin.php file, we’ll be creating a new plugin…
<?php
/**
* WordPress Docker Xdebug plugin
*
* @package WpDockerXdebug
* @author Mario Yepes
* @copyright 2020 Mario Yepes
* @license GPL-2.0-or-later
*
* @wordpress-plugin
* Plugin Name: WordPress Docker Xdebug plugin
* Plugin URI: https://marioyepes.com
* Description: A plugin that shows the status of Xdebug in Tools > Xdebug Info
* Version: 1.0.0
* Requires at least: 5.2
* Requires PHP: 7.2
* Author: Mario Yepes
* Author URI: https://marioyepes.com
* Text Domain: wordpress-docker-xdebug
* License: GPL v2 or later
* License URI: http://www.gnu.org/licenses/gpl-2.0.txt
* Update URI: https://marioyepes.com
*/
add_action( 'admin_menu', 'add_php_info_page' );
function add_php_info_page() {
add_submenu_page(
'tools.php', // Parent page
'Xdebug Info', // Menu title
'Xdebug Info', // Page title
'manage_options', // user "role"
'php-info-page', // page slug
'php_info_page_body'); // callback function
}
function php_info_page_body() {
$message = '<h2>No Xdebug enabled</h2>';
if ( function_exists( 'xdebug_info' ) ) {
xdebug_info();
} else {
echo $message;
}
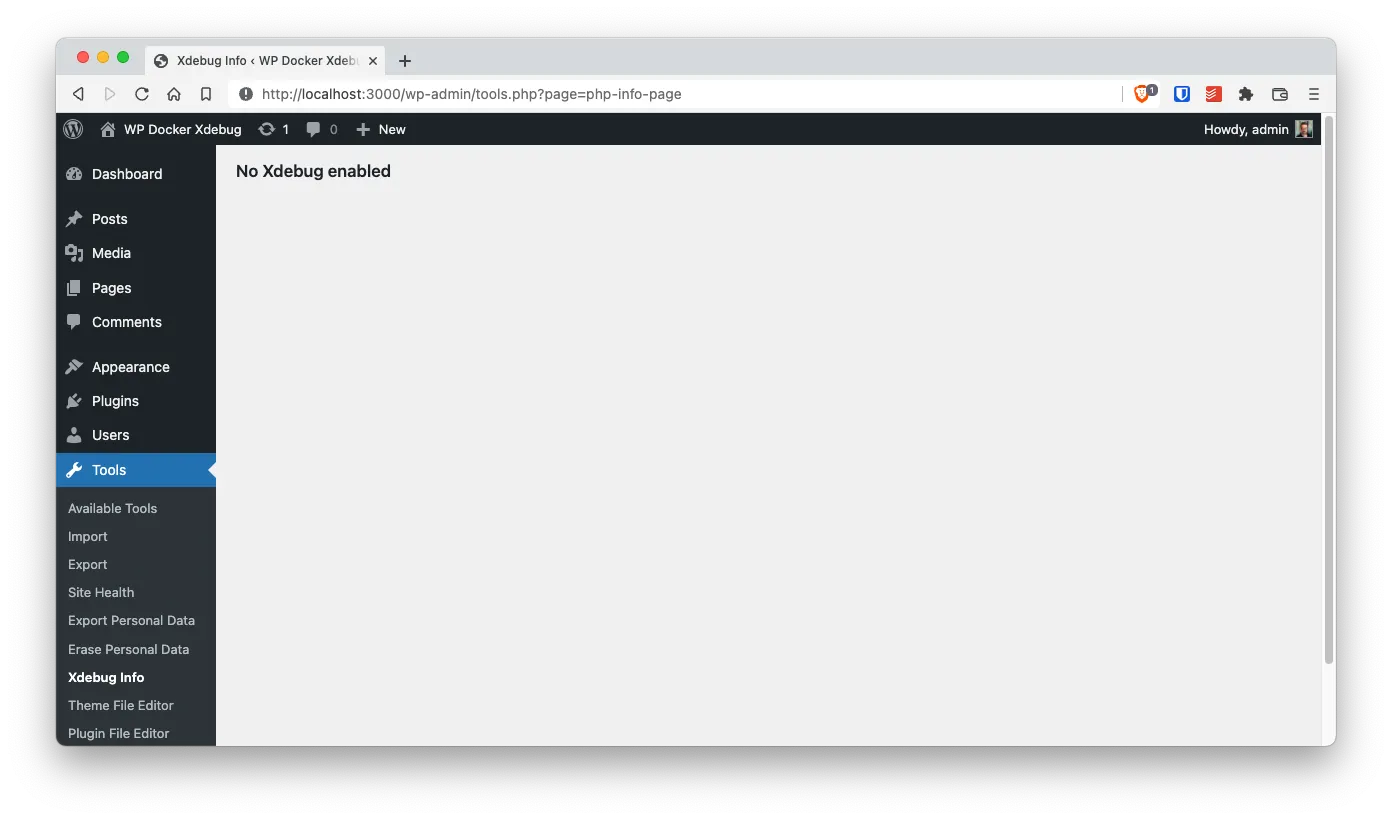
}What this plugin does is just to create a new page in the WordPress Dashboard under Tools > Xdebug with info of the status of Xdebug:
Up to here we have a full WordPress installation with a plugin that will tell us the status of Xdebug. Let’s change the WordPress image to include Xdebug
Create a custom Docker Image
First a disclosure. You could actually make this work without using a custom image, and sticking to commands inside the docker-compose.yaml file. But this would make the file way too complicated, and very rigid. That’s why we are going to replace the current WordPress image with a custom, and very simple image.
The reason why we didn’t do this in the first place, create our custom image that is, is to be able to test our plugin and make sure that it detects if Xdebug is present or not.
To add a custom docker image we have to do 2 things:
- Create a
Dockerfilewith the configuration of our custom image - Update
docker-compose.yamlto use our custom image instead of the official WordPress image
So on the Dockerfile add the following:
# Source image
FROM wordpress:5-apache

# We're going to use this path multile times. So save it in a variable.
ARG XDEBUG_INI="/usr/local/etc/php/conf.d/xdebug.ini"

# Install AND configure Xdebug
RUN pecl install xdebug \
    && docker-php-ext-enable xdebug \
    && echo "[xdebug]" > $XDEBUG_INI \
    && echo "xdebug.mode = debug" >> $XDEBUG_INI \
    && echo "xdebug.start_with_request = trigger" >> $XDEBUG_INI \
    && echo "xdebug.client_port = 9003" >> $XDEBUG_INI \
    && echo "xdebug.client_host = 'host.docker.internal'" >> $XDEBUG_INI \
    && echo "xdebug.log = /tmp/xdebug.log" >> $XDEBUG_INI
Lets explain a little:
- We’re instructing Docker to create an image using as base the
wordpress:5-apacheimage - Then we declare the
XDEBUG_INIvariable with the path of thexdebugconfiguration. This is just to make the file a little cleaner - Next, on a single command we do 3 things:
- Install the
xdebugextension usingpecl - Enable the extension using the
docker-php-ext-enablecommand - We create the
/user/local/etc/conf.d/xdebug.inifile using multipleechocalls
- Install the
The important part of the xdebug.ini file are the variables xdebug.client_host and xdebug.start_with_request. The first variable instructs Xdebug to connect to the debugger client host.docker.internal. The second variable tells Xdebug to only start this connection if the XDEBUG_TRIGGER URL is present in the request.
Next, you need to modify the docker-compose.yaml file. Just changing the official image for the custom one we just created in the Dockerfile:
# ...
  wp:
    build: ./
    container_name: wp-xdebug-wp
    environment:
      WORDPRESS_DB_HOST: wp-xdebug-db
      WORDPRESS_DB_USER: wordpress
      WORDPRESS_DB_PASSWORD: wordpress
      WORDPRESS_DB_NAME: wordpress
    volumes:
      - wp-xdebug-html:/var/www/html
      - ./:/var/www/html/wp-content/plugins/wordpress-docker-xdebug
    ports:
      - 3000:80
# ...
Notice that we don’t have a image field, but a build field!
For this changes to take effect, you need to restart your docker environment:
docker-compose down
docker-compose up -d
And now, if you visit the Xdebug info page, you should see something like this:
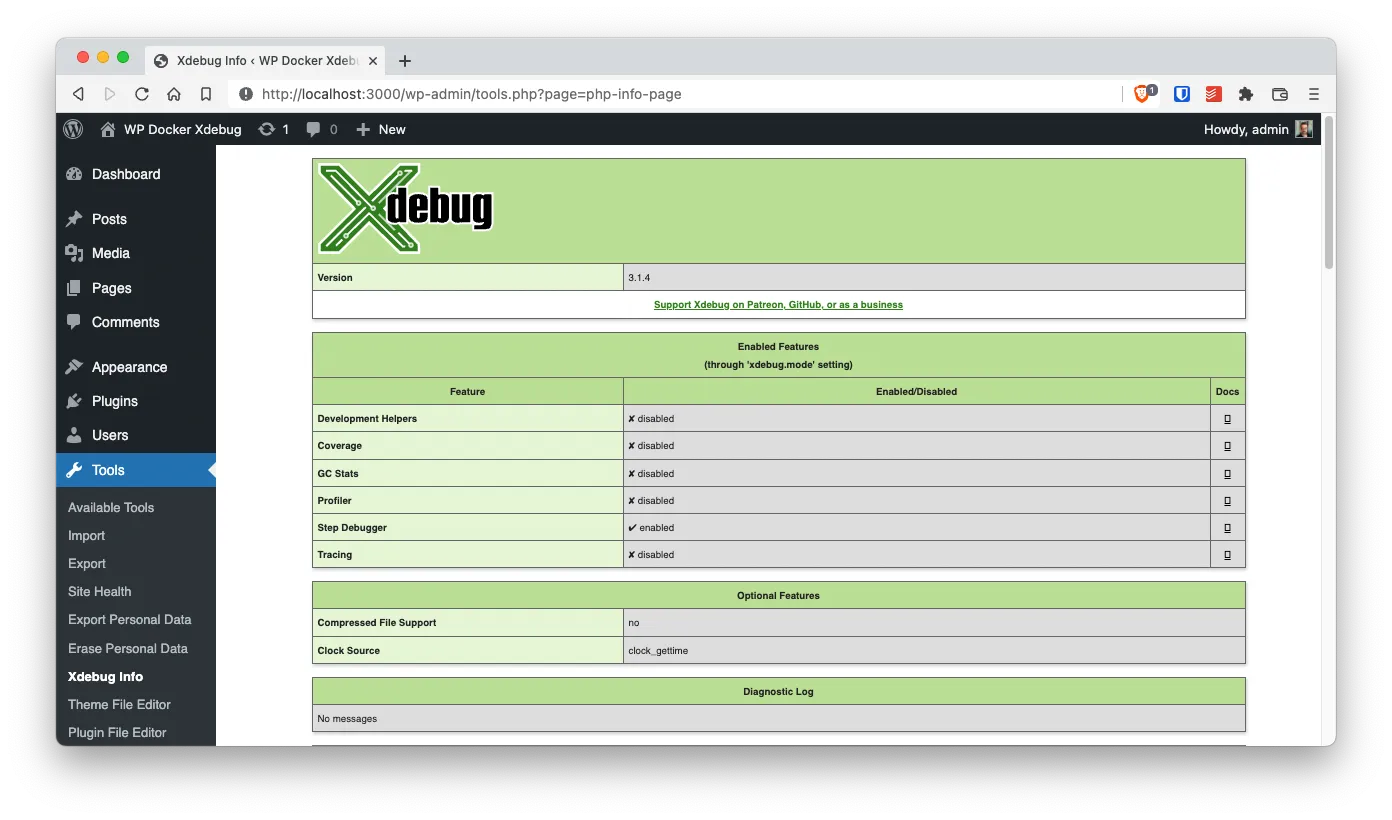
Great we’re done with Docker.
Explaining some Gotchas
OK, so we’ve been breezing over the xdebug configuration. We should explain some things before we continue:
How does Xdebug works
In a very summarized way, what xdebug does is that when debugging is active it will try to connect to port 9003 of the xdebug.client_host to send and receive debugging information.
The way to instruct Xdebug that it should connect to our IDE, or in other words activate debugging, is by passing the XDEBUG_TRIGGER URL parameter or cookie when calling our script. For example http://localhost:3000/wp-admin/tools.php?page=php-info-page&XDEBUG_TRIGGER
This can be a drag… Passing an URL parameter all the time. Latter we will see how to make that process easier with cookies.
The xdebug.ini file
The xdebug.ini file should be placed in PHP’s conf.d directory, which can change from installation to installation. In my case, to figure out where this directory was placed, I executed php -i inside the WordPress container, and review the output searching for where the ini files where placed.
In case your are wondering how this file looks, here are the contents:
# /usr/local/etc/php/conf.d/xdebug.ini
[xdebug]
xdebug.mode = debug
xdebug.start_with_request = trigger
xdebug.client_port = 9003
xdebug.client_host = 'host.docker.internal'
xdebug.log = /tmp/xdebug.log
The host.docker.internal host
One of the biggest issues with Xdebug, is that it will connect to a specific host that needs to be configured in the xdebug.ini file.
Fortunately, Docker provides use with a workaround to connect from de container to the host: Use the special host host.docker.internal, which resolves to the internal IP address used by the host. This is for development purpose and will not work in a production environment outside of Docker Desktop.
Installing Xdebug
Another advantage of using Docker’s WordPress image is that it comes with pecl pre-configured and it provides the docker-php-ext-enable command, which allows us enable/disable extensions with just one command. So to install xdebug inside the container, we could just issue the following:
pecl install xdebug
docker-php-ext-enable xdebug
service apache2 reload
Configure Visual Studio Code
Ok, we should now understand what we did in the Docker configuration. Now lets see how we start using debugging in our IDE.
To configure debugging in Visual Studio Code we need 2 things:
- Install the PHP Debug extension. This will allow VSCode to listen on a given port (in our case 9003) for debug information.
- Create the
.vscode/launch.jsonwith information on how to map our current WorkSpace to a directory inside the Docker container among other things.
To create the launch.json file, just go to Run > Add Configuration
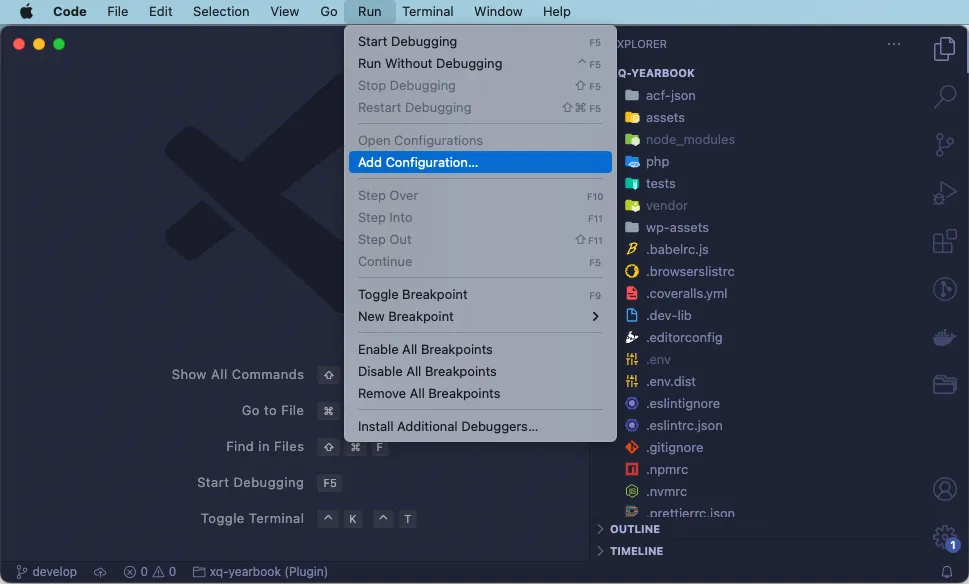
And select the PHP option
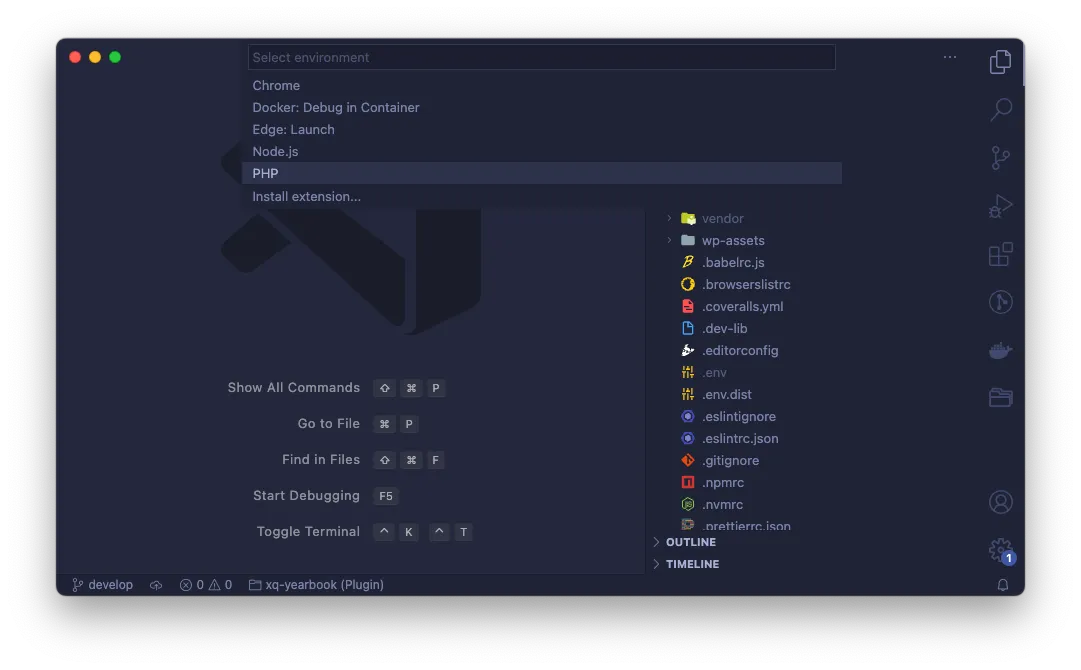
And on the resulting file modify the entry Listen for Xdebug to look like this:
{
  "version": "0.2.0",
  "configurations": [
    "...",
    {
      "name": "Listen for XDebug",
      "type": "php",
      "request": "launch",
      "port": 9003,
      "pathMappings": {
        "/var/www/html/wp-content/plugins/wordpress-docker-xdebug": "${workspaceFolder}"
      },
      "log": true
    }
    "..."
  ]
}
Take into account that:
- Xdebug 2 uses port 9000. Xdebug 3 uses port 9003. That’s why we need to specify the port
- Update the
pathMappingsto point to"/container/path/to/the/plugin": "${worspaceRoot}"since that’s where our code lives inside our container
Start a debugging session
Our setup is ready! No we have to learn how to start a debugging session.
The step are very simple:
- Create a breakpoint in your code
- Click on the start icon on Visual Studio or select Run > Start Debugging
- Visit a page passing the trigger variable in the URL
Remember, you have to pass the XDEBUG_TRIGGER variable either as an URL parameter or as a cookie parameter to the script you are debuging. Otherwise your browser will keep loading and not show anything.
youtube: https://youtube.com/shorts/MQdC3FrBFIA
And since passing the XDEBUG_TRIGGER variable constantly can be very frustrating, I recommend using the Xdebug helper for chrome extension and have it pass that variable as a cookie for you:
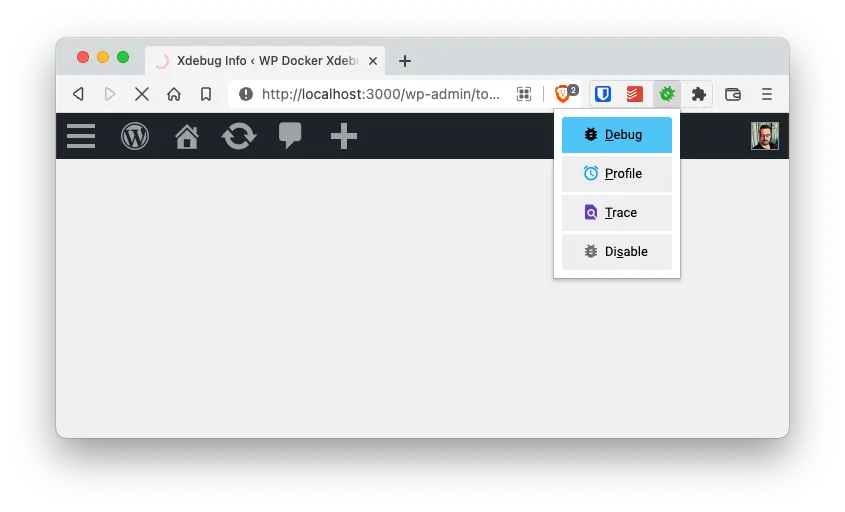
And that’s it! You are debugging WordPress.
Resources
- In this GitHub repo you can access the files created for this article https://github.com/marioy47/wordpress-docker-xdebug
- Xdebug settings for the
xdebug.inifile: https://xdebug.org/docs/all_settings#start_with_request - Another approach on setting debugging in Docker: https://www.larry.dev/xdebug-on-docker/